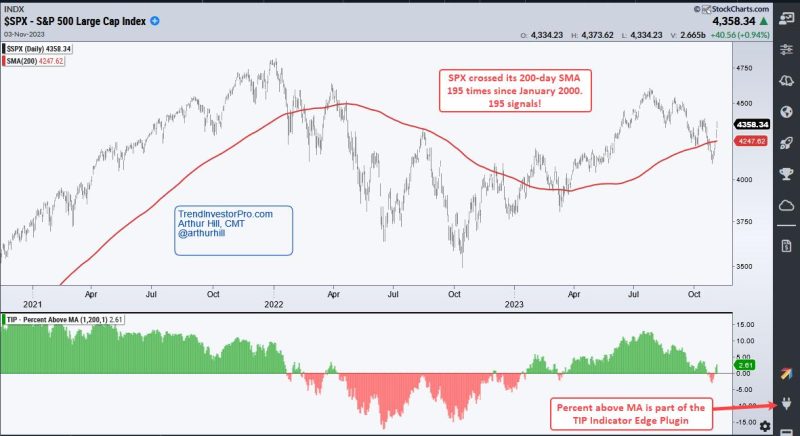
Since the stock market crash of March 2020, traders and investors have been looking for intermediate-term momentum signals to help them decide when to enter the market, and when to exit. One of the most reliable and widely used indicators has been the 200-day moving average (SMA), which tracks price changes over a predetermined amount of time.
Up until recently, the 200 day SMA has typically acted as a support level, keeping prices in an upward direction. However, in recent months, the 200 day SMA has become a battleground between buyers and sellers.
The 200 day SMA is currently standing near 3,215 on the S&P 500. This level is a major support area for the market, and any break below could result in a further decline. On the flip side, a break above this level could signal a potential breakout to the upside.
At this point, it is difficult to say who will win the battle for the 200 day SMA. Bullish investors are expecting a break out, while bears remain skeptical. It could be a while before we find out who will win this critical technical battle.
In the short term, traders should be aware of the critical support and resistance levels around the 200 day SMA. If prices break below it, short-term traders may want to look for bearish positions, while long-term investors may want to adjust their portfolio accordingly. Likewise, if prices push above the 200 day SMA, it could be a sign of things to come in the stock market.
Whichever direction the stock market is going, the 200 day SMA will continue to be a reliable indicator for traders and investors. As such, traders should pay close attention to this critical technical support level, and adjust their strategies accordingly.

